A Crisis That Escalated Fast and Exploded in August
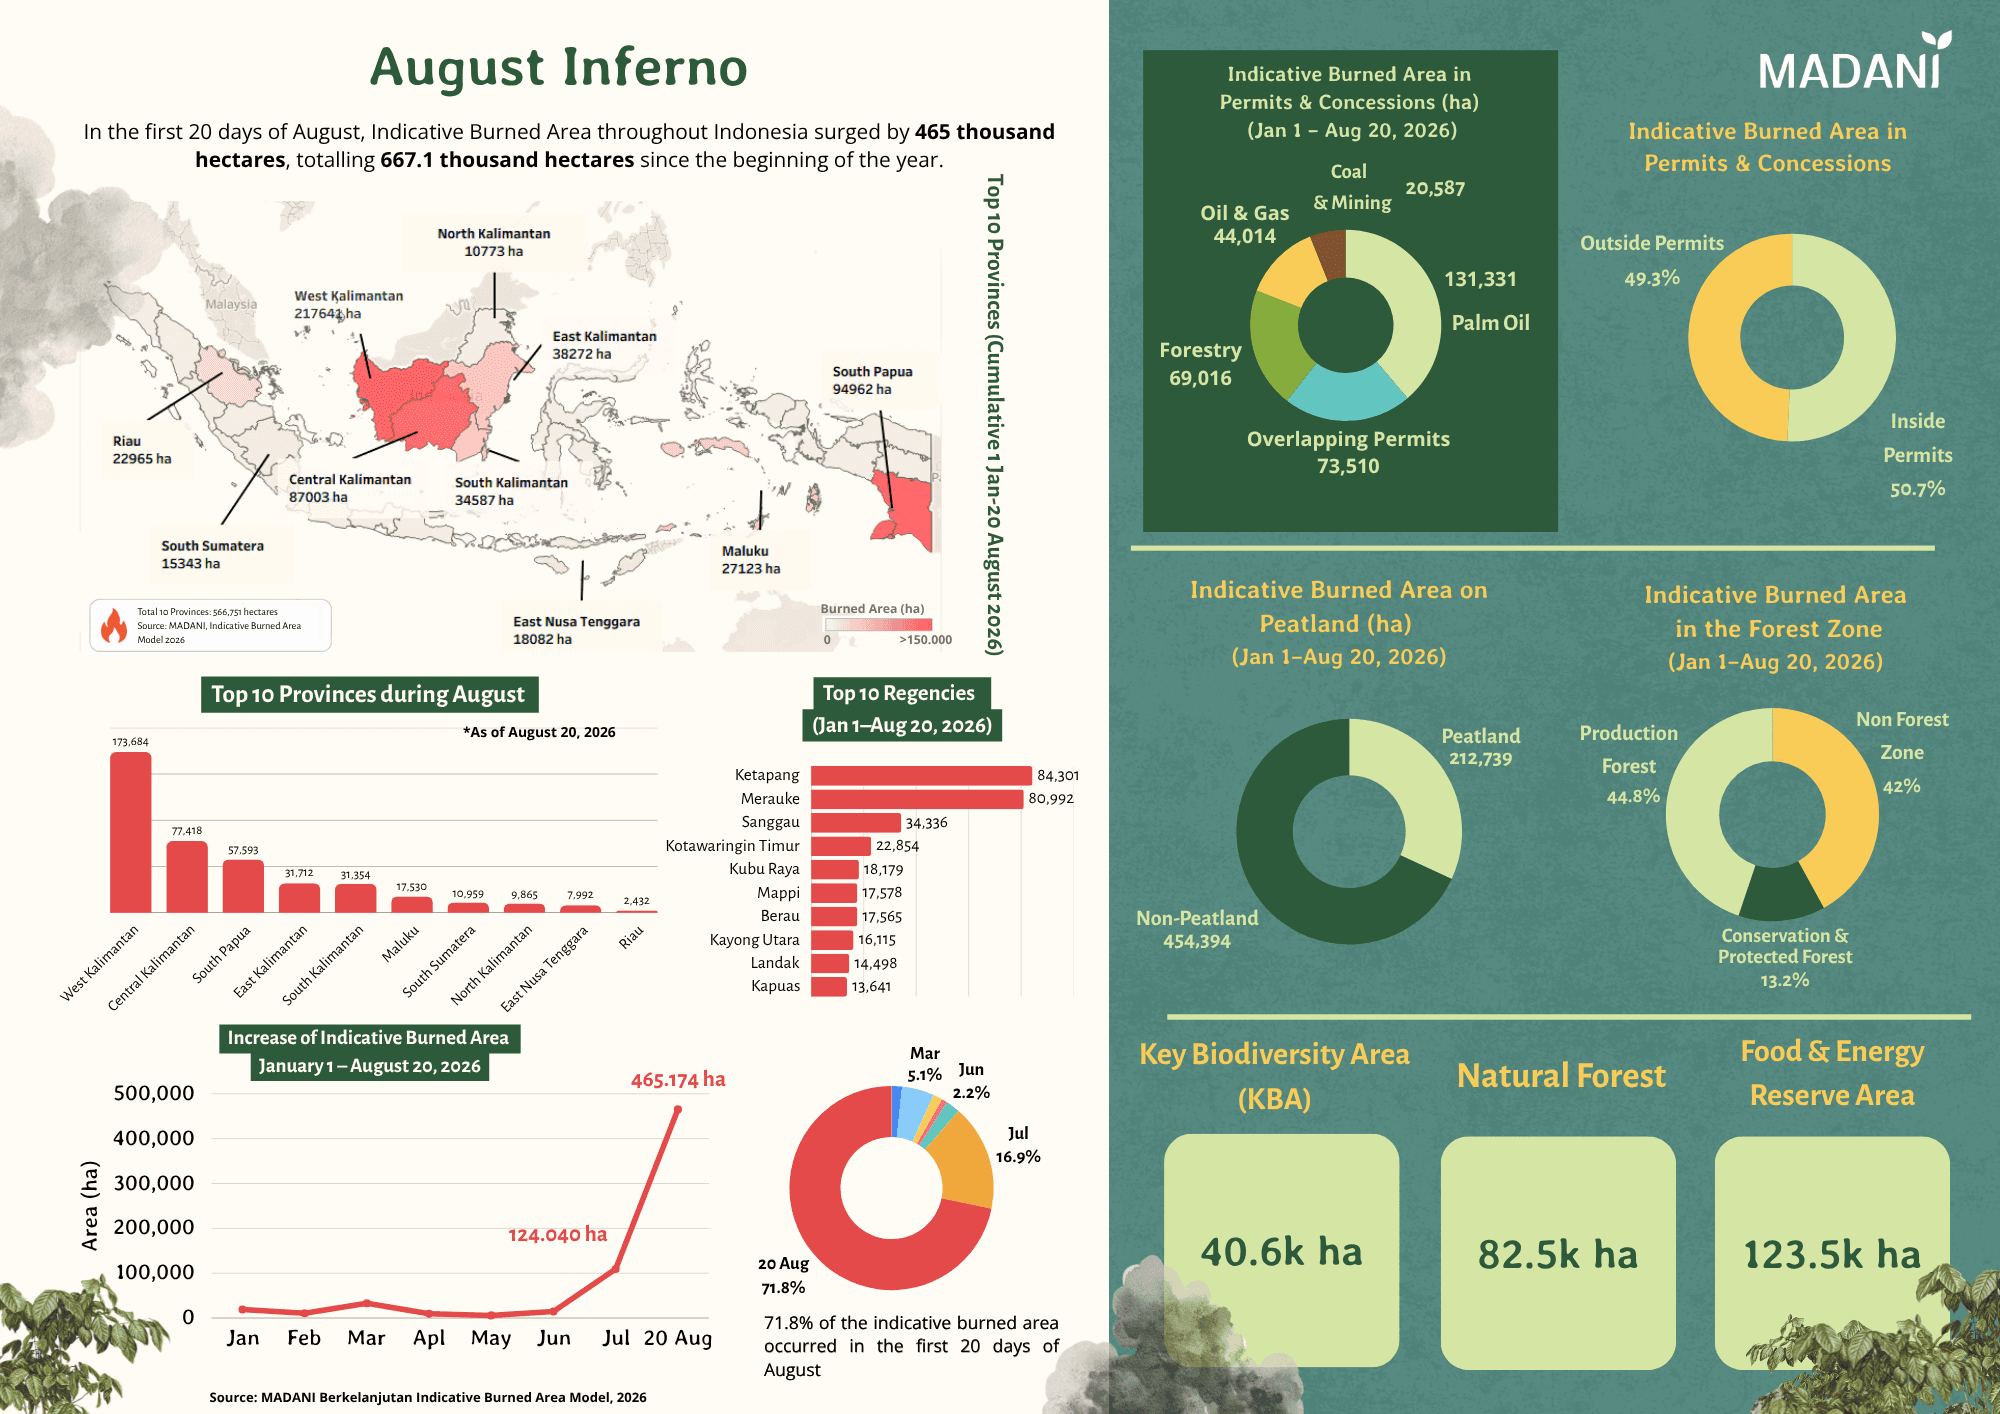
Since the start of 2026, environmental observers had been warning that this year would be a "hot" one. With El Niño Godzilla backed by solid scientific projections, 2026 was always going to put Indonesia's climate commitments to the test. Early warning signs were already visible in the Indicative Burned Area (AIT)* data, which recorded 67,450 hectares burned between January and March. But the situation has since spiraled into something far more severe. As of 20 August 2026, the cumulative indicative burned area across Indonesia has reached 667,133 hectares.
This is not just a number on a chart it's the collision of climate change with fragile land governance. August has been especially brutal: in just 20 days, fires consumed an additional 465,174 hectares. That means nearly 70% of everything burned in 2026 happened in under three weeks.
The chart is available for download here: https://drive.google.com/uc?export=download&id=1LnbYphZ6HRWhr5779w8oMFazOuitRZCu
For context, July's burned area totaled 109,244 hectares. The jump from July to August shows just how sharply the dry season peak and land vulnerability have accelerated. Where earlier in the year the concern was fires breaking out even during the rainy season, we're now facing a second-half surge that is stretching firefighting capacity and resources well past their limits.
Where the Fires Are Burning and the Toll on Protected Peatlands
The fires are not spread evenly. Kalimantan and Papua have become the epicenters of this national crisis. West Kalimantan leads with 217,641 hectares burned, followed by South Papua at 94,962.4 hectares and Central Kalimantan at 87,003 hectares.
But the more troubling story is what's happening to peatland ecosystems. Of the total area burned, 212,739 hectares sit on peatland and peat is essentially a giant carbon vault. When it burns, the emissions it releases dwarf those from mineral-soil forest fires.
The picture gets even harder to swallow when you look at where on peatland the fires are hitting. The split between peatland under cultivation and peatland under protection status is almost exactly even: 106,273 hectares in Peatland Cultivation Function areas versus 106,466 hectares in Peatland Protection Function areas. Fires burning through land that is supposed to be protected point to a real breakdown in ecological safeguards a failure that, frankly, was foreseeable the moment the Peat and Mangrove Restoration Agency (BRGM) was dissolved.
These were the areas meant to be shielded by clear governance, precisely to keep massive carbon emissions out of the atmosphere. Instead, the evidence on the ground shows that the very ecosystems meant to protect our climate stability have become its biggest casualties victims of either negligence or a simple inability to keep fires under control.
Who's Accountable: Licensed Concessions vs. Open Land
Regulatory compliance deserves just as much scrutiny here. The data shows fires splitting almost evenly between licensed and unlicensed land: 338,459 hectares (about 50.7%) burned inside licensed concession areas, while 328,675 hectares (about 49.3%) burned outside them.
By sector, palm oil plantation licenses account for the largest share at 131,331 hectares, followed by the forestry sector's PBPH (Forest Utilization Business License) permits at 69,016 hectares. On top of that, overlapping license areas where multiple permits cover the same land added another 73,510.4 hectares to the total.
The message this sends for policy is unambiguous: a single-track approach to mitigation won't cut it anymore. The government needs a firm, two-pronged strategy. On one side, compliance audits and real sanctions need to land on concession holders particularly palm oil and PBPH companies whose land has burned extensively. On the other, community-based prevention programs need real investment, alongside more effective canal blocking in areas outside concessions. Without action on both fronts, these numbers will simply repeat themselves year after year.
Why the Numbers Don't Always Match and Why That's Worth Talking About
It's worth acknowledging upfront that some figures in this article may raise eyebrows. There's a notable gap between Madani's Indicative Burned Area (AIT) model and the government's official SiPongi (KLHK) data through July. In the hardest-hit provinces West Kalimantan and South Papua AIT detected significantly larger burned areas than SiPongi: +14,224.7 hectares and +16,701.7 hectares, respectively.
A gap like this isn't unusual in complex spatial analysis. If anything, it's a strong argument for cross-validating monitoring systems rather than treating any single dataset as gospel. Combining the strengths of different monitoring approaches would sharpen and speed up firefighting response on the ground, catching small fires before they spiral into full-blown disasters. Rather than get stuck arguing over whose numbers are right, this is a moment to collaborate and open up space for real dialogue between institutions.
The Bottom Line
2026 and August in particular has become a stark warning. With 667,133 hectares burned as of 20 August, Indonesia's greenhouse gas reduction commitments are on the line. Every hectare of peat that burns isn't just environmental damage at the moment; it's a hit to our shared chances of hitting global climate targets. It's time to move past simply monitoring these fires and start addressing what's actually causing them.
About the Indicative Burned Area (AIT)*
All fire data referenced in this article comes from MADANI’s Indicative Burned Area (AIT) model. Developed since 2019, AIT was built to track fire movement early, updating as frequently as every three days. It's built from hotspot data filtered against strict criteria: high confidence readings, located away from non-fire heat sources (industrial facilities, urban areas, active volcanic craters, etc.), and clustered closely enough to be modeled into areas suspected of currently or previously burning. Model validation and verification show that AIT and SIPONGI consistently maintain a correlation coefficient above 90% and an R² value above 80% on the trendline scatter plot for January–July 2026, with relatively similar accumulation figures and distribution across provinces.